How Many RPS Do You Actually Need? Sizing Your Solana RPC Plan
Solana RPC sizing guide: why your average RPS number misleads, how method weights multiply real load, and the formula operators use to stop getting throttled.
On this page +
The operator bought the 100 RPS plan. Their app was averaging 12 RPS on the dashboard. They were still getting throttled.
We see this every few weeks. Operators spend days checking their code, filing tickets with their provider, assuming something's broken. It isn't. The provider's accounting is correct. The operator's math isn't.
There are three gaps between what most operators calculate and what they actually need. They compound. Miss all three and a 10 RPS estimate becomes a 400 RPS requirement. Here's exactly how that happens.
01Gap 1: Raw Requests ≠ Weighted Capacity#
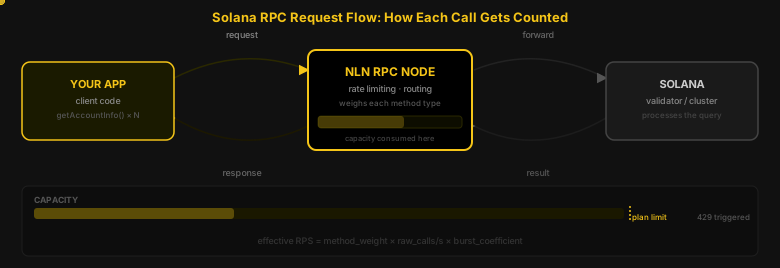
When an RPC endpoint says you have a 100 RPS limit, that limit is enforced against capacity units, not raw request count. Most dashboards show raw count because it's the easiest metric to surface. Capacity units are what actually trigger the 429s.
Different RPC methods consume very different amounts of infrastructure. A getBalance call is a single key lookup against the accounts database. It's almost free. A getProgramAccounts call without filters is a full table scan across every account owned by a program. On large programs like Raydium or Orca, that scan touches millions of records.
These aren't the same call. Treating them the same way for capacity planning is Gap 1.
That operator averaging 12 RPS? Four of those calls were unfiltered getProgramAccounts on a large program. Each one was consuming 20–50 capacity units. Their actual weighted load during peak windows was pushing 200 units per second. The plan said 100. The real load was 200. The 429s weren't a bug. They were correct.
Here's the weight table we use internally when sizing plans for clients. These are approximations. Actual weights vary by provider, filter quality, and data size. But the order of magnitude is consistent across every setup we've worked with.
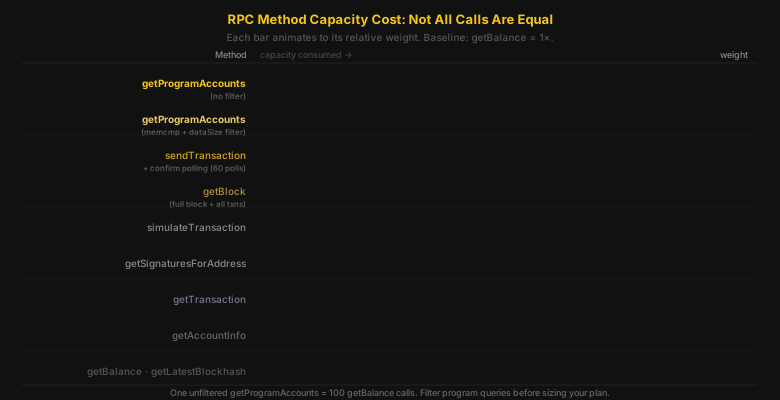
The biggest lever most operators haven't pulled is getProgramAccounts filter quality. Adding dataSize and memcmp filters to narrow results can cut the weight from 80× down to 8× on the same query. Same data. One-tenth the cost. That's worth doing before you consider upgrading a plan.
getMultipleAccounts deserves a second look too. It shows as one call on most dashboards. Pass 50 accounts and it's behaving like 50 individual calls. Easy to miss when you're watching raw count.
02Gap 2: Average RPS ≠ Burst RPS#
Average RPS is nearly useless as a sizing metric. Here's why.
A trading bot that averages 8 RPS across the day looks fine on every dashboard. The operator's on a 50 RPS plan. The headroom looks comfortable. It's not even close to the limit.
Then a token launches. A whale opens a position. Liquidation conditions trigger across four protocols at once.
For 90 seconds, the bot hits 140 RPS. The 50 RPS plan can't hold it. 429s start. The bot stops working at the exact moment the market's moving.
That's not bad luck. It's what happens when you size for average instead of burst.
The metric that matters is the burst coefficient: peak RPS divided by average RPS over the same period. For trading bots, it's typically 10–20×. For dApps with bursty user sessions, 3–8× is common. For indexers during initial sync, 50–100× isn't unusual. The backfill load dwarfs steady-state traffic entirely.
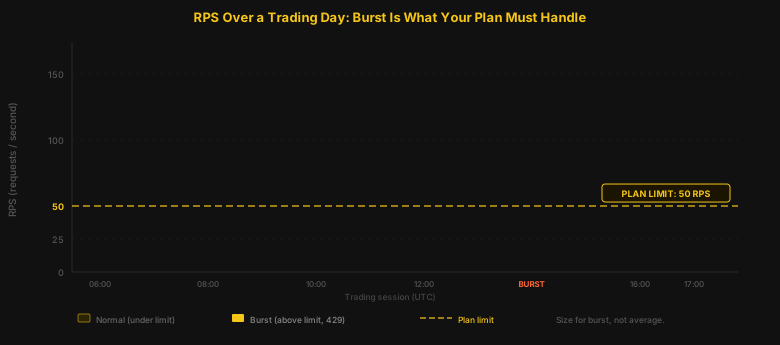
Average is the number that looks good in reporting. Burst is the number that determines whether you're throttled. If you don't know your burst coefficient yet, you don't have enough data to pick a plan.
03Gap 3: Visible Calls ≠ Total Calls#
This is the one that blindsides operators who've already accounted for the first two.
You think you're sending 3 transactions per second. Count it out loud. Three. That's it. You calculate 3 RPS, apply the send weight, round up to 8, and you're buying the 20 RPS plan with room to spare.
Here's what you're actually sending.
sendTransaction at 2.5× weight: 7.5 RPS.
Now you need to know if each transaction landed. The standard approach: call getSignatureStatuses every 500ms until you get a confirmed status or hit the 30-second timeout. That's up to 60 calls per transaction.
3 sends × 60 confirmation polls = 180 additional RPS.
Total: 187.5 RPS. From 3 TPS. You bought 20.
That's not a rounding error. It's a 9× gap from a single multiplier that shows up on almost no dashboard we've seen. The sends look cheap. The polling is invisible until you instrument it. By the time you notice, you've been getting throttled for weeks without understanding why.
Retry amplification
The second hidden multiplier is what happens after you hit the limit.
Your client gets a 429 response with a Retry-After header. Usually 1–5 seconds. It retries. That's expected behavior.
The problem is timing. When a high-throughput app hits a rate limit, every connection gets the same 429 at roughly the same moment. The header says wait 1 second. Every connection waits 1 second. Every connection retries together.
That's the thundering herd problem. The retry wave hits with 2–3× your normal peak load because all the retries land simultaneously. If your peak already pushed you to the limit, the retry wave pushes you past it again. More 429s. More synchronized retries. The loop continues until traffic settles on its own.
You can't size your way out of this without a buffer. Sizing right at your peak means the first throttling event creates a second, larger one immediately after.
04Running the Gaps#
Before you can apply the formula, you need real profiler data from your actual workload. Not a test environment. Not idle traffic. Real market conditions, including at least one genuine peak window.
Here's the profiler we deploy when sizing plans for clients:
Wrap this around every RPC call your bot or app makes. The by_method breakdown is what you're after. In our experience, one or two methods account for 80% of weighted load for most operators. Those are the methods to optimize before you spend on a larger plan.
Once you've got real profiler output, apply this formula:
Worked example for a liquidation bot.
Base calls at steady state:
- 5
getAccountInfoper second (monitoring collateral positions) - 1
getProgramAccountsper minute (fetching open positions list) - 2
sendTransactionper second (executing liquidations)
Weighted base RPS: 5 × 1 = 5, plus 1/60 × 20 = 0.33, plus 2 × 2.5 = 5. Total: 10.33 weighted RPS.
Add confirmation loops: 2 sends × 60 polls = 120 additional RPS during active confirmation windows. Running total: 130.33 RPS.
Apply burst coefficient (8×, liquidation cascade): 10.33 × 8 = 82.6 base burst, plus 120 confirmation overhead = 202.6 RPS at peak.
Add 2× retry buffer: 202.6 × 2 = 405 RPS. Recommended plan: 400 RPS minimum.
The operator who ran a quick back-of-napkin estimate saw 10 base RPS and bought a 20 RPS plan. After accounting for all three gaps, the actual requirement is 400 RPS. That's a 20× error. We see this exact gap regularly, usually after three days of the operator telling us their endpoint is “broken.”
05When the Gaps Collide#
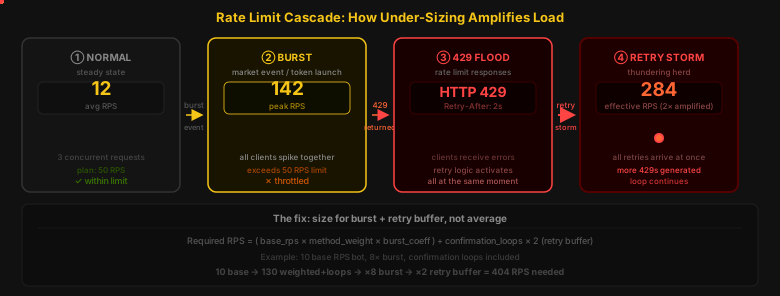
The first signal is 429 responses. The Retry-After header says wait 1–5 seconds. It feels manageable.
It isn't. Not for bots. Not for anything latency-sensitive.
Naive clients ignore the header and retry immediately. Load amplifies. Sophisticated clients respect the backoff, but they still miss the window. A liquidation opportunity is open for seconds. You're backed off for 2. By the time the retry goes through, the position's been taken by a bot that sized correctly and didn't hit the limit.
The cost of under-sizing isn't slower responses. It's the bot stopping at the exact moment the market's moving. For liquidation and MEV bots, that's not inconvenient. That's the entire job.
We've watched operators lose months of potential revenue during a single 4-hour event window because their plan couldn't sustain peak load. The fix was a plan upgrade that took 10 minutes to implement. The math that justified it took 30 minutes to run. All three gaps were there. None of them had been calculated.
The gaps don't announce themselves early. They show up as 429s at the worst possible time.
06Before You Run the Numbers#
Instrument your real workload first. Don't size from a test or staging environment. It doesn't replicate burst patterns, synchronized retry behavior, or confirmation loop overlap under actual contention.
- Run the profiler through at least one genuine peak window: a token launch, an epoch change, a volatile market hour. Idle data underestimates your real load by 10× or more.
- Find your burst window from the profiler output. Your burst coefficient won't show up in daily averages. You need the peak period isolated, not averaged away.
- Pull the
by_methodbreakdown and find what's driving your weighted load. IfgetProgramAccountsis on the list without tight filters, fix that first. Getting filters right can drop your capacity cost by 4–10× on that method alone, before you change your plan or spend anything extra. - Apply the formula. Add the 2× retry buffer. That buffer isn't optional. Skip it and the first throttling event creates a second, worse one right behind it.
07Frequently Asked Questions#
What is RPS in Solana RPC?
Requests per second. But it's not raw request count that determines whether you're throttled — it's weighted capacity units. Heavy methods like getProgramAccounts consume 20–100× more capacity than a getBalance. Your plan's limit applies to those weighted units, not the number your dashboard shows.
Why am I getting throttled when I'm under my RPS limit?
You're under the raw count limit. You're over the weighted capacity limit. Check which methods you're calling most frequently and multiply by their weights. getProgramAccounts without precise filters is the most common cause. One unfiltered call on a large program can equal 100 getBalance calls.
What Solana RPC method uses the most capacity?
Unfiltered getProgramAccounts. It scans every account the program owns. Add dataSize and memcmp filters and you can cut the cost by 4–10× on the same query.
How do I measure my actual RPC usage?
Use the profiler above. Wrap it around every RPC call and run it through a real peak window, not idle traffic. Low-activity periods underestimate your real load by 10× or more.
What is burst RPS?
Your peak request rate during a short, high-activity window. A bot averaging 8 RPS can hit 140 RPS for 90 seconds during a market event. That's the number your plan needs to handle. Your daily average doesn't matter.
Does sendTransaction count as one RPS?
The send itself is 2–3 RPS. The confirmation polling adds up to 60 calls per transaction if you're polling every 500ms for up to 30 seconds. For a bot sending 3 TPS, confirmation polling alone generates 180 RPS on top of the sends. That's the number most operators don't see coming.
You've run the formula. The number's higher than you expected. That's the right number. For teams running high-throughput bots where confirmation loop overhead is eating into plan capacity, NLN Yellowstone gRPC streams block data directly: confirmation loops collapse to a single subscription and you're not burning RPS polling for transaction status. For teams that need historical data alongside live RPC access to calibrate the profiler against real past events, NLN Historical Raw Blocks gives you the complete on-chain record to work from. If you want to talk through your specific call mix, talk to an engineer.
Every benchmark in this blog runs against our public endpoints.
Spin up an RPC, WebSocket, or gRPC endpoint in under a minute. Flat pricing, no request caps. Reproduce the numbers for your own workload.