How to Evaluate a Solana Data-Stream Provider (Checklist)
A three-phase protocol for evaluating Solana gRPC stream providers: pre-contract questions that disqualify bad fits, week-1 tests with pass/fail criteria, and a printable checklist.
On this page +
Most teams evaluate providers during a demo. That's the worst possible time to evaluate anything. The provider controls the environment, the traffic level, the account filters, and the example transactions. Everything looks fast. Everything looks complete.
The gaps show up later. Under a PumpFun launch. During an epoch boundary. At 2am when the stream drops and the reconnection logic takes 40 seconds instead of 2. We don't know this from theory. We know it from watching teams discover it in production and then come to us to describe what broke.
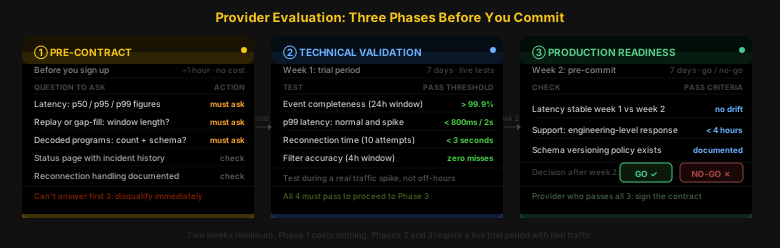
We've built this protocol from what we watch serious operators do before they commit. Three phases. Specific tests. Measurable criteria. If a provider passes all three, you have enough signal to make a real decision.
01Phase 1: Pre-Contract Screening#
This phase costs nothing. It's what you do before signing up for any trial. Five questions that filter out bad fits in under an hour.
The Five Questions
Q1: “What is your p99 stream latency during high-traffic events?”
Why it matters: average latency is useless. During a token launch or liquidation cascade, p99 defines whether your bot catches the event or misses it. Any provider who gives you only the average is hiding the number that matters.
What a good answer looks like: specific figures for p50, p95, and p99 measured over a defined period. Not “under 100ms.” Actual numbers with a measurement window attached.
Q2: “What happens if I miss events. Can I replay them?”
Why it matters: network blips happen. Your process restarts. If you miss a slot window and can't replay, you have a permanent gap. For indexers and analytics systems, there's no recovering it after the fact.
What a good answer looks like: a specific replay window, such as 30 days of historical blocks accessible via the same interface or an adjacent API.
Q3: “How many programs do you decode, and can I see the full schema?”
Why it matters: raw bytes are useless for most applications. Decoded data means the provider has parsed program instructions into typed structs. The number of decoded programs and the depth of decoding varies enormously across providers, and you can't evaluate what isn't published.
What a good answer looks like: a specific count with a public schema. Thirty-seven decoded programs and 1,074 typed event types is a number you can audit. Not “all major programs.”
Q4: “Do you have a public status page with incident history?”
Why it matters: self-reported uptime numbers are meaningless. A public status page with real incident history tells you how often things go wrong and how fast the team communicates when they do.
Q5: “What is the billing model if there's a service incident?”
Not about the money. About whether the provider takes incidents seriously enough to have a policy at all. A provider who hasn't thought about this hasn't thought carefully about operating the service.
Documentation Tells You More Than the Sales Call
Before any call: read their documentation. Specifically look for three things.
- Filter parameter documentation. If it's absent or shallow, they haven't thought about high-volume use cases. Operators who run MEV bots and indexers don't want to filter client-side. If the docs don't explain filtering at the subscription level, that's a signal about what's actually implemented.
- Versioning policy. Do they break schemas without warning? A provider that changes decoded event types without a migration path forces emergency fixes into your production deployment.
- Reconnection handling. Do they document what happens on disconnect? Teams that publish detailed operational documentation have actually run this under pressure. Teams that publish marketing copy haven't. It's usually obvious which is which after five minutes of reading.
02Phase 2: Technical Validation (Week 1)#
You're in the trial. Here's what to test.
Test 1: Event Completeness
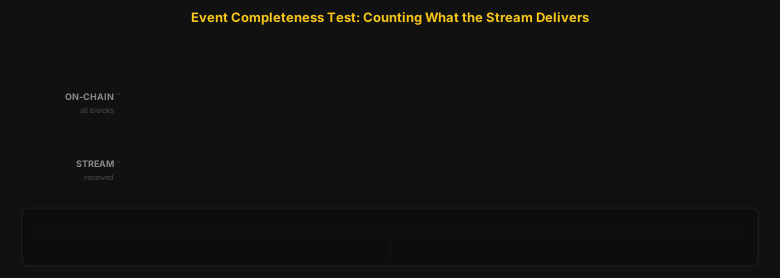
Set up a listener on a known high-activity account or program. For 24 hours, count every event the stream delivers. Then independently verify against a public RPC endpoint or block explorer. The percentage of events that arrived is your completeness rate.
- Pass criteria: 99.9% or higher over the 24-hour window.
- Red flag: anything under 99.5%, or the provider can't tell you their own completeness rate when you ask.
We've seen providers delivering 97% event completeness presented as “real-time.” That 3% gap doesn't land on quiet periods. It lands during high-throughput bursts, exactly when the stream can't keep up. A liquidation event isn't quieter than normal traffic. It's the opposite.
Test 2: Latency Under Load
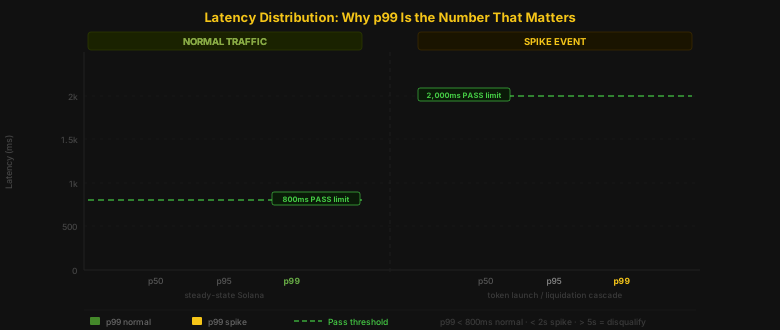
Don't measure latency during off-hours. Measure during a genuine traffic spike. A token launch, an epoch change, a volatile market hour. Set up a timestamp from block confirmation to event receipt on your side. Run this for a full 24-hour window and capture p50, p95, and p99 separately.
- Pass criteria for p99: under 800ms during normal traffic. Under 2 seconds during a high-throughput event.
- Red flag: p99 exceeds 5 seconds during any period, or the provider can't supply their own latency metrics on request. If they don't track it, they can't fix it.
Test 3: Reconnection Behaviour
Kill your connection deliberately. Time how long until the stream is fully re-established and delivering events again. Do this at least 10 times at different hours.
- Pass criteria: reconnection in under 3 seconds, 95% of the time. Events gapless on reconnect, or a gap-fill mechanism available to recover the missed window.
- Red flag: reconnection regularly takes over 10 seconds, or events from the gap window are simply lost with no recovery path.
This test sounds obvious. Most teams don't run it until after they've deployed to production and experienced the first drop. By then you're debugging at 2am instead of during evaluation.
Test 4: Filter Accuracy
Set a specific account or program filter. Verify that every event you receive matches the filter criteria. Then verify you're not missing events that should have matched.
- Pass criteria: zero false positives and zero false negatives over a 4-hour window.
- Red flag: the provider is filtering client-side and sending all events regardless, or filters only work on a subset of programs. Both mean your subscriber is doing work the stream layer should handle.
03Phase 3: Production Readiness Check (Week 2)#
The trial looked good. Week 2 is where the real evaluation happens.
Watch for Trial-Tier Prioritisation
Some providers deliver better performance during trials than in production. It's hard to prove definitively, but the signals are there if you're watching.
Latency metrics that were solid in week 1 drift slightly worse as your trial approaches expiry. Support responsiveness declines after you've technically passed the evaluation window. We've seen this pattern enough times to flag it here without qualification.
Document your latency measurements from day 1. If there's a trend toward degradation mid-trial, that's signal. Don't explain it away as normal variance without checking.
Test the Support Response
Send a technical question to support during the evaluation. Not a ticket. A real question that requires an engineer to answer. “What is your delivery guarantee model for events during a validator restart?” works well.
- Pass criteria: substantive engineering-level response within 4 hours.
- Red flag: canned response, redirect to documentation, or no response for 24 hours. If they can't answer a technical question during the evaluation window, they can't answer one at 2am when something's actually broken and you're losing money.
Check Schema Stability
Review their changelog or schema versioning history. Has the decoded event schema changed in the last 6 months? Was there a migration path when it did?
Breaking schema changes without versioning force emergency production fixes. You don't want to discover this 3 months after integration when a schema update silently breaks your event parser and your monitoring doesn't catch it until trades stop executing.
04The Checklist#
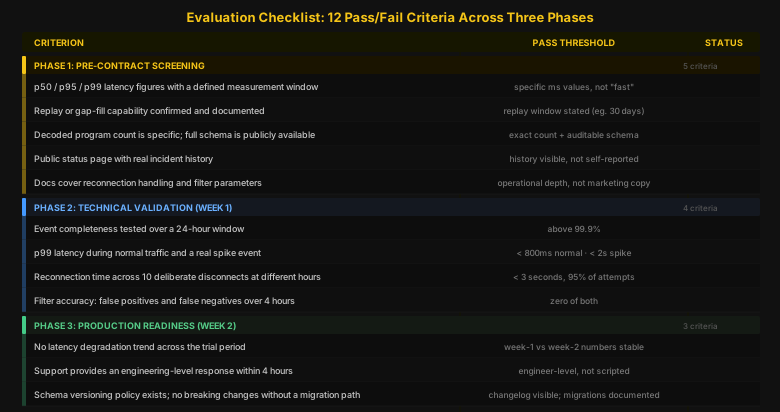
Every pass/fail criterion from all three phases. Work through it before you sign anything.
Phase 1: Pre-Contract
- Provider gives p50, p95, and p99 latency figures with a defined measurement window
- Replay or gap-fill capability confirmed and documented
- Decoded program count is specific; full schema is publicly available
- Public status page exists with real incident history
- Documentation covers reconnection handling and filter parameters at the subscription level
Phase 2: Technical Validation (Week 1)
- Event completeness above 99.9% over a 24-hour window
- p99 latency under 800ms during normal traffic, under 2 seconds during a spike
- Reconnection completes in under 3 seconds for 95% of attempts
- Filter accuracy: zero false positives and zero false negatives over a 4-hour window
Phase 3: Production Readiness (Week 2)
- No latency degradation trend across the trial period
- Support provides an engineering-level response within 4 hours
- Schema versioning policy exists; no breaking changes deployed without a migration path
05Red Flags That End the Evaluation Immediately#
Some things aren't about pass/fail thresholds. They disqualify a provider on the spot.
- They can't tell you their event completeness rate. That means they don't measure it. A provider who doesn't measure completeness isn't operating this at production quality.
- They have no public documentation on reconnection handling. The stream drops. It always does eventually. If they haven't documented recovery, they haven't solved it.
- Their decoded program list is proprietary and can't be audited. You can't verify what you're subscribing to. That's not a documentation gap. That's a trust problem.
- Their uptime guarantee covers only the API layer, not the stream itself. The stream is what you're paying for. An uptime SLA that excludes the stream is not an uptime SLA.
- They can't name a team member to contact when something goes wrong at 2am. Not a support email. A person.
We've seen all five of these from providers currently operating in production. The ones that can't answer aren't bad at communication. They haven't solved the underlying problem. That doesn't get better after you've signed a contract.
06Frequently Asked Questions#
What is a Solana data-stream provider?
A service that delivers Solana on-chain events to your application in real time via a persistent connection, typically gRPC. Different from standard JSON-RPC polling. You subscribe once and events push to you. No polling loops. No missed slots from timing gaps between requests.
What's the difference between Yellowstone gRPC and standard RPC?
Standard RPC is pull. You ask, it answers. Yellowstone gRPC is push. Events arrive the moment they're confirmed, without you having to request them. For trading bots and indexers, that's the difference between catching an event and reacting to one you already missed.
How do I test latency on a stream provider?
Instrument your subscriber with timestamps. Record when the event arrives on your side. Compare against the block confirmation time from a public RPC endpoint. Do this across a 24-hour window that includes at least one traffic spike. p99 is the number that matters. Average latency tells you nothing useful about how the stream behaves under pressure.
What should p99 latency be?
Under 800ms during normal Solana traffic. Under 2 seconds during a high-throughput event like a token launch. Anything consistently over 5 seconds at p99 means your bot is making decisions on stale data.
What is event completeness and why does it matter?
Completeness is the percentage of on-chain events your subscriber actually receives. A provider at 97% completeness is dropping 3 events in 100. During normal traffic that's tolerable. During a liquidation cascade or PumpFun launch, those 3 events are the ones you needed most.
What are the red flags to watch for?
Provider can't give you p99 latency figures. No public status page. Decoded program list isn't auditable. No replay or gap-fill for missed events. Support tickets go to a generalist instead of an engineer. Any one of these is a reason to keep looking.
If you've run this evaluation and want to see where NLN sits against each criterion, the numbers are documented, not marketed. NLN Yellowstone gRPC covers the stream-side criteria: 37 decoded programs, 1,074 typed event types, latency figures measured against production traffic, and filter implementation documented at the parameter level. NLN Historical Raw Blocks covers replay and gap-fill, with schema documentation at the event level. To see how NLN compares against the criteria in this checklist, talk to an engineer.
Filtered Geyser streams for indexers, bots, and production data pipelines.
Decoded swaps, token lifecycle events, transfers, and system feeds.
Per-program, per-instruction topics delivered in their source shape.
Every benchmark in this blog runs against our public endpoints.
Spin up an RPC, WebSocket, or gRPC endpoint in under a minute. Flat pricing, no request caps. Reproduce the numbers for your own workload.