Solana VPS vs VDS vs Bare Metal: What Should Your Trading Bot Run On?
CPU steal, network jitter, and disk I/O spikes kill trading bots silently. Measure all three on your current host and find out which server tier actually fixes them.
On this page +
Your bot missed a fill. Same strategy. Same signal. The trade that worked in backtests executed 43ms late in production. No exception. No error log. The CPU was stolen mid-execution by another tenant on the same physical host.
Infrastructure failure is silent. It doesn't throw errors. It shows up as bad fills, missed exits, and strategies that look broken when they aren't.
Three things cause it. None of them are your code.
Three Things That Kill Trading Bots Before the Strategy Does#
Most server comparisons stop at specs: vCPUs, RAM, storage. None of those numbers tell you what you actually need to know: how much of your execution time the host is stealing back.
Three failure modes show up consistently across trading bot deployments:
CPU steal. Your VM's CPU cycles handed to another tenant's workload mid-execution. Your process is runnable. It just can't run. The hypervisor scheduled someone else first.
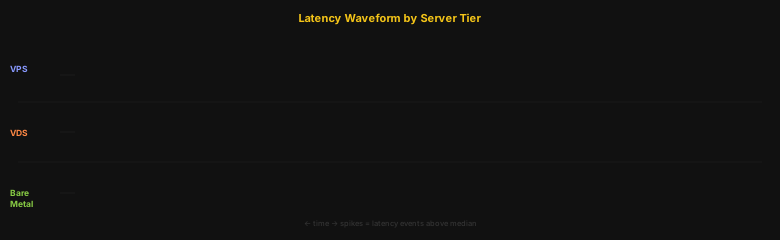
Network jitter. P99 latency spikes that don't appear in the average but fire at the worst possible moment. A 1ms median hides a 40ms spike. That spike is when your order goes out late.
Memory contention and disk I/O. Shared storage pressure from neighbouring tenants slowing your checkpoint writes, trade logs, and local RPC cache. Sub-millisecond operations become 8ms operations under host load.
Each section below diagnoses one of these. It tells you how to measure it, what numbers to expect per tier, and which tier actually fixes it. At the end, there's a single Python script that runs all three checks and prints a verdict.
01Bottleneck 1: CPU Steal#
The Linux kernel tracks CPU steal time in /proc/stat. It's the eighth field in the first line: the percentage of wall-clock time your process was runnable but couldn't execute because the hypervisor gave those cycles to another VM.
On a shared VPS, dozens of tenants sit on the same physical host. When a neighbour's database kicks off a vacuum, a backup job runs, or another trading bot hits peak load, the hypervisor rebalances. Your cycles go to them. Your execution stalls. The kernel records it as stolen time, not as an error.
A 20ms steal event doesn't look like anything in your application logs. Your bot just fires 20ms later than it was supposed to.
Run this on your current host. The number it prints is your baseline.
What each tier gives you:
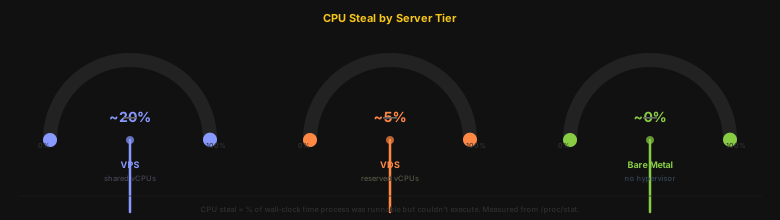
VPS. CPU steal commonly spikes 15–25% on busy hosts. Five-minute averages look fine. The individual events that matter, like a 200ms steal mid-order, don't show in the average. They show in your fills.
VDS. Reserved vCPUs reduce steal to 1–8%. Neighbours still exist but the hypervisor enforces CPU limits on their VMs. Steal events still happen; they're just smaller and less frequent.
Bare Metal. Zero CPU steal. No hypervisor. Your process owns the cores. There's nothing to schedule around.
02Bottleneck 2: Network Jitter#
A 1ms average ping to your RPC endpoint sounds fast. It's not the number that matters.
P99 is.
If your bot sends 100 orders and 99 go out in 1ms but one takes 45ms because a burst of tenant traffic hit the shared NIC buffer, you lost that trade. The average stays at 1.4ms. The logs show no anomaly. The fill came back wrong.
Shared VPS network interfaces are virtualised and multiplexed across tenants. Every VM on the host uses the same physical NIC through a virtual switch. When someone else's process sends a burst of traffic, a database replication sync, a video transcode upload, another bot's stream, the switch queues your packets behind theirs. That queue shows up as jitter.
The ratio is the signal. P99/P50 above 10 means your worst-case latency is an order of magnitude above your typical latency. That gap is where bots lose trades.
What each tier gives you:
VPS. P99 commonly runs 10–40× P50 under host load. The virtual switch has no per-tenant isolation. Your traffic competes equally with everyone else's.
VDS. A dedicated virtual NIC removes the shared switch bottleneck. Jitter ratio typically drops to 2–5×. Still virtualised, but isolated enough for most DEX arb strategies.
Bare Metal. Physical NIC, no virtual switch, no queue contention. P99 typically within 2× P50. The remaining jitter comes from the network path itself, not from the host.
03Bottleneck 3: Memory Contention and Disk I/O#
Trading bots touch disk more than most people expect. Checkpoint files. Trade logs. Position state. Local RPC cache. On VPS, storage is a shared pool. Every VM on the host writes to the same underlying storage controller. When a neighbour's process hammers I/O, a database flush, a backup snapshot, log rotation, your writes queue behind it.
A 4KB write that normally takes 0.1ms can take 8ms when the storage controller is saturated. If your bot writes a checkpoint after each order, that 8ms shows up directly in your decision loop.
The fsync call matters. Without it, writes land in the OS page cache but aren't committed to storage. The benchmark measures real durability latency, which is the same thing your bot sees when it writes state it can't afford to lose.
What each tier gives you:
VPS. Shared SAN or distributed storage pool. P99 write latency can spike 5–20ms when the controller is under load from other tenants. Median looks fine. Tail is the problem.
VDS. Semi-dedicated storage allocation. More predictable. P99 typically 1–5ms. Still shared infrastructure underneath, but with better isolation than VPS.
Bare Metal. Dedicated NVMe. Sub-millisecond P99 at 4KB write size. No shared controller. No tenant neighbours. The disk is yours.
Which Bot Type Belongs on Which Tier#
The three bottlenecks map directly to three categories of bot. The question isn't which tier is best. It's which tier your bot's latency tolerance requires.
VPS: for bots that don't compete on execution speed. If your bot fires once per minute or once per block and isn't racing against other bots, infrastructure noise doesn't change the outcome. A 20ms steal event on a VPS won't cost you a trade when your timing tolerance is 100ms+. The cost savings are real. Use them.
VDS: for bots that need reserved resources without bare metal pricing. DEX arb bots compete with other arb bots. The goal is to outrun the slowest competitor in your market, not to achieve physical latency limits. A VDS with reserved vCPUs keeps steal below 5%. A dedicated virtual NIC brings jitter ratio under 4×. That's enough to compete in most DEX arb environments. Not enough for MEV.
Bare Metal: for bots where a single stolen millisecond changes the outcome. MEV bots, liquidators, and sniper bots compete at the transaction level. A steal event means your transaction lands in a later block. A jitter spike means a competitor's order arrives at the validator first. There's no strategy adjustment that compensates for infrastructure noise at that resolution. Bare metal is the only option that removes all three bottlenecks.
NLN VPS covers macro and moderate-frequency strategies. NLN VDS is the right tier for DEX arb and strategies that need reserved resources without bare metal cost. For latency-critical bots (MEV, snipers, liquidators) NLN Bare Metal removes all three bottlenecks at the hardware level.
Run This Before You Upgrade#
Before you pay for an upgrade, run this. It takes under 60 seconds. It measures all three bottlenecks and prints a plain-English verdict. Don't guess which one is hurting you. Measure it.
Run this on your current host. Then run it again after you move. If steal is under 3% and jitter ratio is under 4×, your infrastructure isn't the problem. If they're not, you know exactly what to fix, and which tier fixes it.
Server location matters here too. Solana's largest validator clusters run in Frankfurt. If your bot is in a different region, network hops add latency that no server tier eliminates. The benchmark measures host-level noise. Geographic latency is separate.
Frequently Asked Questions#
What is CPU steal and why does it affect trading bots?
CPU steal is the percentage of time your VM's CPU was runnable but couldn't execute because the hypervisor gave those cycles to another tenant. For a trading bot, a steal event mid-execution means your order goes out late. The bot doesn't error. It just fires slower than it should. On shared VPS hosts, steal events are random and unscheduled.
What's the difference between VPS and VDS for a trading bot?
A VPS shares physical CPU cores with other tenants. A VDS gives you reserved vCPUs that aren't shared with anyone. CPU steal on a VDS is much lower, typically 1–8% versus 15–25% on a busy VPS. VDS usually comes with a dedicated virtual NIC too, which reduces network jitter. Both are still virtualised, so bare metal is the only option for zero steal.
When is bare metal overkill for a Solana bot?
If your bot fires once per block or less, or it doesn't compete with other bots on execution speed, bare metal is overkill. Macro strategies, long-only bots, and any strategy with latency tolerance above 100ms run fine on VPS. The cost savings are real. Bare metal is for MEV, liquidators, and sniper bots where a 20ms steal event changes the outcome.
How do I measure network jitter on my server?
Send 200 probes to your RPC endpoint and record each round-trip time. Compute P50 and P99. If P99 is more than 10× P50, you have a jitter problem. A 1ms median with 40ms P99 is worse for a bot than a 3ms median with 5ms P99. The benchmark script in this article does this automatically and prints a verdict.
What latency does a DEX arb bot actually need?
DEX arb bots compete with other arb bots, not with validators. The practical threshold is 20–100ms end-to-end from signal to fill confirmation. A VDS with reserved vCPUs and a dedicated NIC brings CPU steal below 5% and jitter ratio below 4×, enough to compete at this level. Below 20ms, you're in bare metal territory.
Does server location matter for Solana trading bots?
Yes. Solana's largest validator clusters are in Frankfurt, New York, and Tokyo. Hosting your bot in Frankfurt puts it physically close to a large share of the validator set, reducing hops between your order and the validators processing it. Co-location doesn't help if your server has high CPU steal, but it's a real edge when everything else is equal.
How do I run the benchmark from this article?
Copy the combined benchmark script, replace RPC_HOST and RPC_PORT with your actual endpoint, and run it with Python 3. It takes about 60 seconds. It measures CPU steal, disk write P99, and network jitter ratio, then prints a verdict telling you whether to stay on your current tier or upgrade.
How does VDS compare to Bare Metal on cost vs performance?
VDS costs significantly less than bare metal and eliminates CPU steal almost entirely. For most DEX arb and moderate-frequency strategies, VDS is the right call. The remaining gap, no hypervisor overhead, dedicated physical NIC, NVMe latency, only matters when your bot competes at millisecond resolution. If you're not sure which side of that line you're on, run the benchmark first.
Can a shared VPS ever work for MEV?
No. MEV bots compete at the transaction level. A single CPU steal event of 20ms means your transaction lands in a later block than a competitor's. There's no strategy adjustment that fixes infrastructure noise at that level. MEV requires bare metal.
How much throughput does a Yellowstone gRPC stream need?
A Yellowstone gRPC stream subscribed to all transactions runs at roughly 200–400 Mbps sustained. Filtered streams, meaning specific accounts or programs, are much lower, typically 10–50 Mbps. VPS plans usually come with 1 Gbps shared uplinks, sufficient for filtered streams. Bare metal with a dedicated NIC gives you more headroom for burst events.
What does a dedicated NIC mean in practice?
A dedicated NIC means your VM has exclusive access to a physical network interface rather than sharing one with other tenants. Shared NICs are managed by a virtual switch that queues competing traffic. A dedicated NIC removes that queue. VDS plans typically include dedicated virtual NICs. Bare metal has a physical NIC with no virtualisation layer at all.
How often should I re-run the benchmark after upgrading?
Run it immediately after moving to confirm the upgrade fixed the issue. Then run it monthly, or after any significant change to your bot's workload. CPU steal can increase on VPS hosts as the provider adds more tenants. A benchmark that passed three months ago might not pass today.
If you've run the benchmark and know which tier you need, NLN Bare Metal is the option for latency-critical bots: owned Frankfurt infrastructure, no virtualisation layer, dedicated NVMe. For DEX arb and moderate-frequency strategies, NLN VDS gives you reserved resources without bare metal pricing.
Filtered Geyser streams for indexers, bots, and production data pipelines.
Raw leader shreds for latency-sensitive trading and MEV systems.
Per-program, per-instruction topics delivered in their source shape.
Every benchmark in this blog runs against our public endpoints.
Spin up an RPC, WebSocket, or gRPC endpoint in under a minute. Flat pricing, no request caps. Reproduce the numbers for your own workload.