- Load PumpFun create and trade Parquet files into DuckDB
- Compute a graduation rate without the two classic counting traps
- Measure time to graduation with medians and percentiles
- Segment launches by creator activity and by early buying
In this lesson
Most PumpFun tokens never leave the bonding curve. This workbook turns that sentence into numbers you calculate yourself: six guided exercises in plain SQL, from loading the files to asking whether early buying predicts graduation. Each exercise has a task, a hint, and a worked answer you can open when you are ready.
01Before you start#
A PumpFun token is born on a bonding curve: a pricing formula that sells tokens for SOL and raises the price as SOL flows in. When the curve has collected roughly 85 SOL of real reserves it graduates. The curve closes, and the SOL and remaining tokens seed a PumpSwap pool where trading continues.
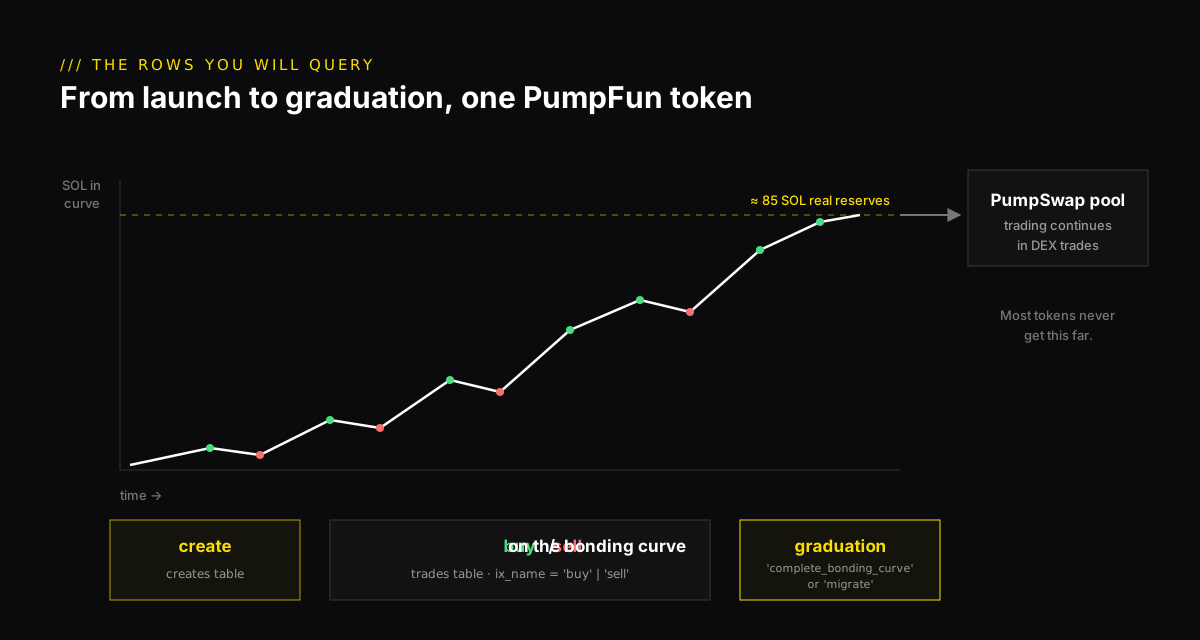
You will work with two tables, one row per event:
The files are the pumpfun_events tables from NoLimitNodes Trading Datasets: one Parquet file per day for creates and one for trades. Any extract with the same columns works. You only need DuckDB, which reads Parquet directly. Start duckdb in the folder with your files and create two views so the exercises stay short:
02Exercise 1: Know your data#
DESCRIBE shows every column and its type. block_time is a Unix timestamp in seconds, so wrap it in to_timestamp() to read it.Show worked answer +
Always run this first. If DESCRIBE shows block_time as a TIMESTAMP in your extract, drop the to_timestamp() calls throughout. If the date range is not what you downloaded, a file is missing, and every rate you compute later will be wrong without warning.
03Exercise 2: Launches per day#
CAST(… AS DATE), then group by it. COUNT(DISTINCT creator) gives unique wallets.Show worked answer +
If launches per creator is well above 1, a few wallets are launching many tokens each. Those are usually launch services, not people. Exercise 5 measures how much that matters.
04Exercise 3: The graduation rate#
ix_name of 'migrate' or 'complete_bonding_curve'. Start from creates, so tokens that never graduated stay in the denominator.Show worked answer +
First, a check that explains the two most common mistakes:
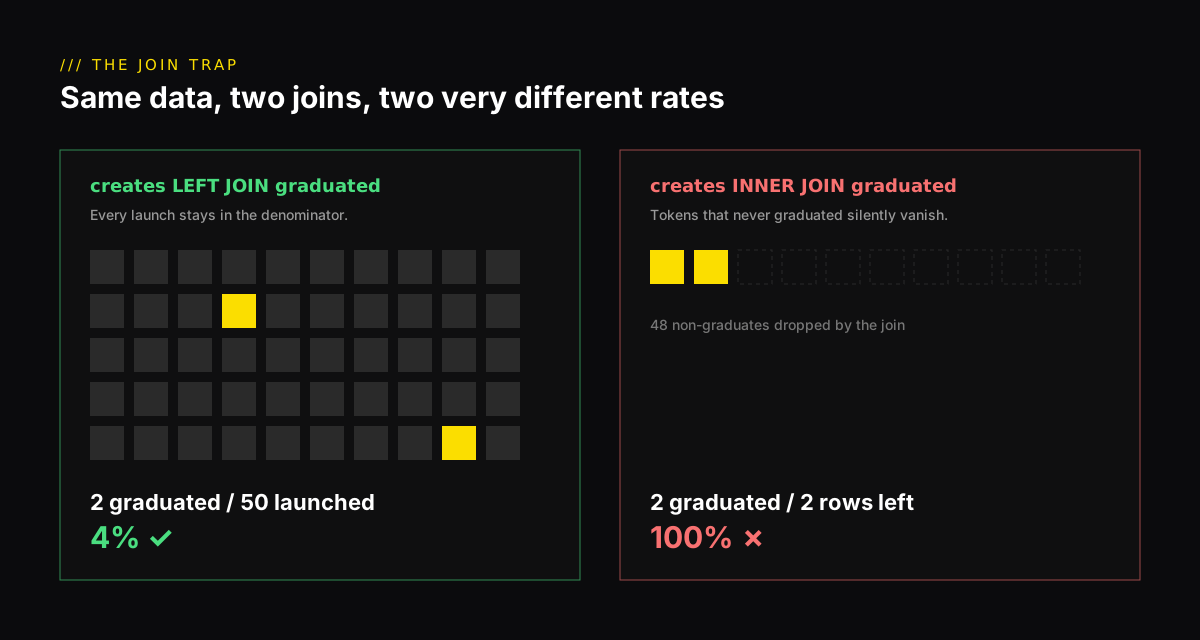
If the two numbers differ, some tokens have more than one graduation row, for example both a complete_bonding_curve and a migrate row. Count rows instead of distinct mints and you double-count those graduations. That is the first trap. Now the rate itself:
The second trap is the join. Use an INNER JOIN and every token that never graduated drops out of the denominator, so the rate climbs toward 100%. Expect a rate in the low single digits. Anything above 20% almost always means a wrong join.
05Exercise 4: Time to graduate#
MIN() and GROUP BY mint, join it to its create row, and subtract. DuckDB’s quantile_cont computes percentiles.Show worked answer +
Here an INNER JOIN is correct, because the question is only about graduated tokens. Use medians, not averages: a handful of tokens that graduate days later would drag an average far from the typical case. Slots give a second, clock-independent measure of the same gap.
06Exercise 5: Do repeat creators do better?#
graduated CTE from exercise 3.Show worked answer +
Read the launches column before the rate. A single wallet in the 50+ bucket can account for a large share of all launches. The creator field is the wallet that signed the create, so a busy wallet is usually a tool or service acting for many people.
07Exercise 6: Does early buying predict graduation?#
ROW_NUMBER() OVER (PARTITION BY mint ORDER BY slot, tx_index). tx_index breaks ties inside a slot, where block_time cannot. Then NTILE(5) makes the groups.Show worked answer +
A rate that rises across the groups is a correlation, not a trading signal. The first buys often come from the creator or from bots acting in the same slot as the launch. Before you trust the pattern, rerun it on a different month and see whether it holds.
08Where to go next#
- Repeat exercises 3 and 6 for each week of your data. A pattern that only shows up in one week is probably noise.
- Follow graduated tokens onto PumpSwap. Post-graduation swaps live in a separate DEX trades table; join it on
mint. - Read PumpFun data analysis: graduation rates and creator wallets for the full column reference and bonding-curve price maths.
- To watch graduations live instead of in yesterday’s files, see the PumpFun data streams, or the real-time data comparison to pick a feed.
Q1You join creates to graduations with an INNER JOIN and get a 96% graduation rate. What went wrong?
Q2Why count DISTINCT mint when counting graduations?
Q3Two buys land in the same slot. Which column orders them correctly?
Frequently asked questions#
What does it mean when a PumpFun token graduates?
Its bonding curve has collected roughly 85 SOL of real reserves. The curve closes and the SOL and remaining tokens seed a PumpSwap pool, where trading continues.
What graduation rate should I expect?
Low single digits. If a query returns more than about 20%, the usual cause is an INNER JOIN that dropped the tokens that never graduated.
Do I need a database server for these exercises?
No. DuckDB runs on your laptop and reads Parquet files directly, so you can query the files where they are.
Where can I get PumpFun data as files?
The pumpfun_events tables in NoLimitNodes Trading Datasets come as daily Parquet files. Any extract with the same columns works with these exercises.